"You have collected hundreds of responses, completed your experiment, or finished your interviews—but now you are staring at the data and wondering: What do I actually do with all of this?"
This is where many research projects slow down.
The data has been collected. The questionnaire worked. The experiment is finished. The interviews are transcribed. Perhaps you even have an SPSS file filled with tables and numbers.
But a dataset is not a research paper.
The real challenge is turning that information into clear evidence, meaningful findings, and a manuscript that a journal can evaluate.
That process starts with research data analysis.
From data cleaning to selecting the analysis and writing the Results and Discussion, each one of these steps must have relevance to the research question.
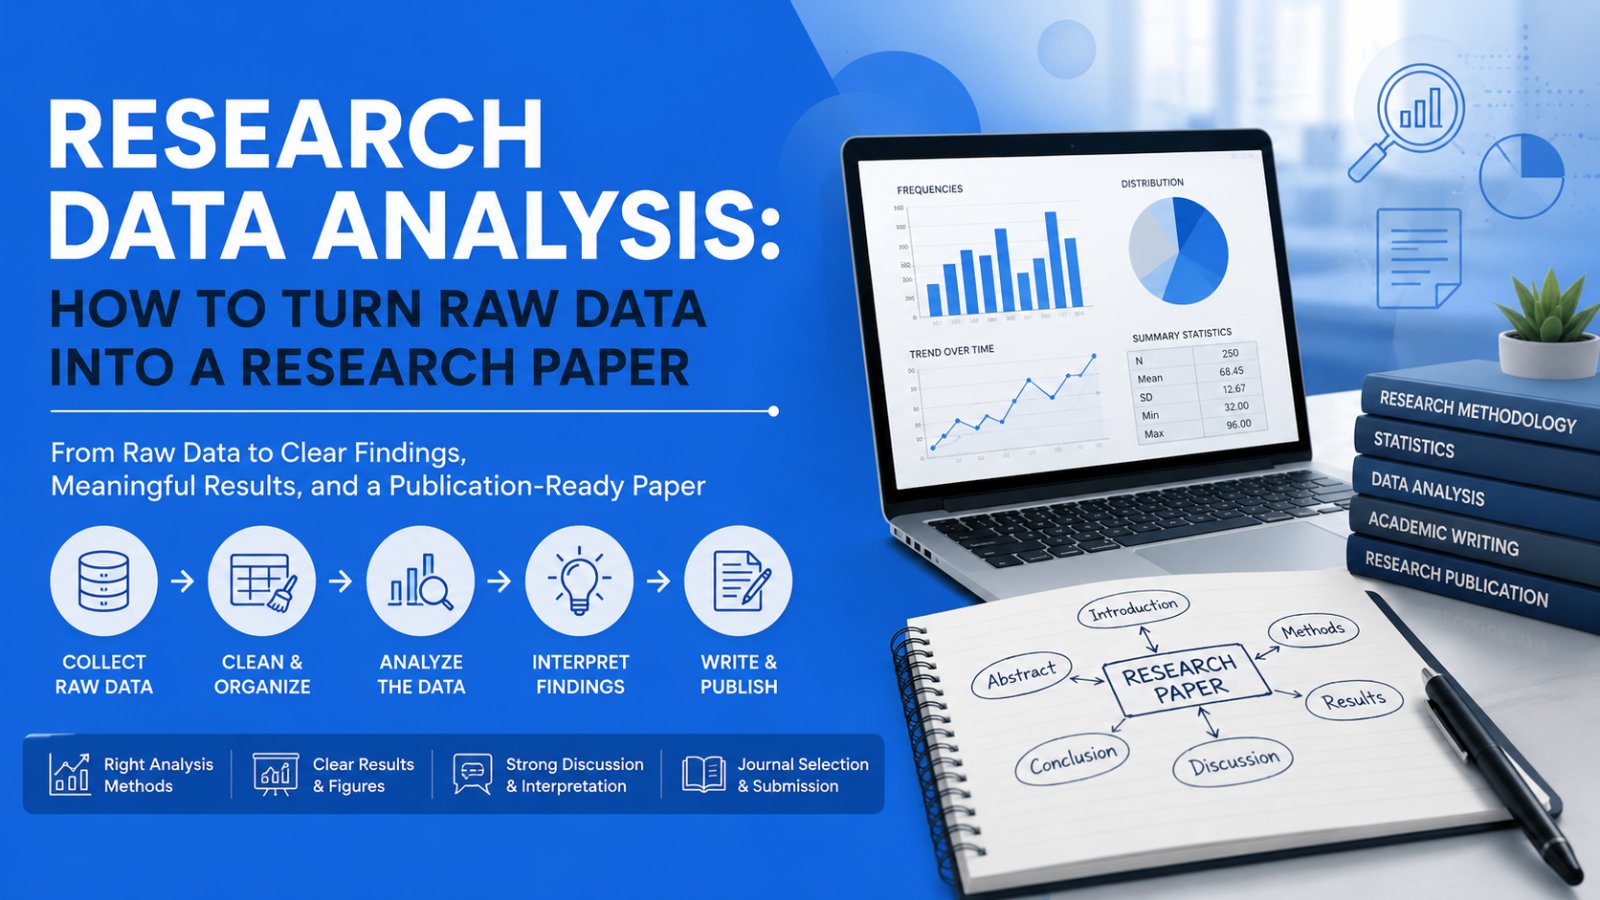
From Raw Data to a Research Paper
Think of the process as a journey:

Skipping one step can create problems later. For example, an unsuitable analysis can produce misleading results, while poorly explained results can make the discussion difficult to write.
1. Start With Your Raw Data
The first question is not, "Which statistical test should I run?"
It is:
"Is my dataset ready to analyze?"
Raw data in research may consist of responses to surveys, data from laboratory experiments, field notes, or any other data gathered during a research process.
Before analysis, check:
- Missing or incomplete responses
- Duplicate records
- Incorrect entries
- Inconsistent coding
- Unusual or impossible values
- Variable names and labels
It is advisable to have an original, untouched backup of the dataset.
This is vital since any error during the cleaning process can impact everything else done afterwards.
2. Decide How to Analyze Your Data
Now comes the question many researchers struggle with:
How should I analyze my research data?
The answer should come from your research question, objectives, study design, and type of data—not simply from the software you have installed.
For example, common quantitative approaches include:
| Research purpose | Possible analysis |
|---|---|
| Describe a sample | Frequencies, percentages, mean, standard deviation |
| Compare two groups | t-test or appropriate alternative |
| Compare multiple groups | ANOVA or appropriate alternative |
| Examine categorical relationships | Chi-square test |
| Examine relationships between variables | Correlation |
| Predict an outcome | Regression |
| Analyze non-normally distributed data | Appropriate non-parametric method |
These are examples, not automatic rules. The correct method depends on the research design and statistical assumptions.
That is why data analysis for research should begin with the research question—not with a software menu.
3. Quantitative and Qualitative Data Need Different Approaches
Not every study produces numbers.
In case of quantitative research, some of the commonly used tools are SPSS, R, Python, or Excel.
Qualitative research is often associated with words, meaning, experiences, and themes.

How qualitative data moves toward findings
For people who are learning how to do data analysis for qualitative research, it is important to understand that software can be used to organise transcripts and coding, but it does not analyse meaning.
4. Check the Analysis Before Trusting the Output
A statistical program can calculate a result correctly even when the wrong method was selected.
That is why researchers should consider the assumptions of the chosen analysis.
Depending on the method, these may include:
- Independence of observations
- Normality
- Homogeneity of variance
- Linearity
- Multicollinearity
- Appropriate measurement levels
The goal is not to use the most complicated statistical method.
The goal is to use a method that appropriately answers the research question and fits the data.
5. Turn Statistical Output Into Research Findings
This is where many researchers get stuck.
You open SPSS and see pages of tables, coefficients, significance values, confidence intervals, and other output.
The temptation is to copy everything into the manuscript.
Don't.
Raw data analysis is not equivalent to reporting all data produced by statistical analysis software.
Rather, you need to focus on analysing those facts which actually solve your research objectives.
For instance, when you investigate whether there is a connection between hours of studying and scores on the test, then the paper must be about that particular analysis, not all other statistics generated during that process.
Good reporting may include, where appropriate:
- Frequencies and percentages
- Means and standard deviations
- Confidence intervals
- Effect sizes
- Test statistics
- P-values
- Tables and figures
The key is relevance.
6. How to Write the Results in Research Paper
One of the most common questions researchers ask is how to write result section in research paper without simply copying statistical output.
Start with one simple principle:
Results answer: What did the study find?
Present your important findings objectively and clearly.
Keep these points in mind:
- Report findings related to the research objectives.
- Present important results in a logical order.
- Use tables when they make information easier to understand.
- Avoid repeating every number from a table in the text.
- Use consistent decimal places and statistical notation.
- Give every table and figure a clear and correct title.
- Do not add lengthy explanations that are part of the Discussion.
If you are wondering how to write result in research paper, focus on communicating the evidence—not displaying everything your software calculated.
7. Move From Results to Interpretation
Numbers tell you what happened. Interpretation helps explain what those findings mean.
Research data interpretation should connect the findings with the original research question and the wider body of knowledge.
Imagine a study finds an association between study time and examination scores.
The Results might report the statistical relationship.
The Discussion then asks:
- Why might this relationship exist?
- Does it agree with earlier research?
- Why might the findings differ?
- What could the finding mean in practice?
- What are the study's limitations?
Avoid making claims that cannot be substantiated by the data. It is, for instance, important not to assume causality simply because of a demonstrated correlation between two variables.
8. How to Write the Discussion
Researchers often struggle with how to write discussion in research paper because they simply repeat the Results.
The Discussion should go further.
A strong Discussion can:
- Begin with the most important finding.
- Explain what the finding means.
- Compare it with previous research.
- Discuss possible explanations.
- Explain academic or practical implications.
- Acknowledge limitations.
- Suggest realistic areas for future research.
Results and Discussion: Keep Them Different
| Results | Discussion |
|---|---|
| What did the study find? | What do the findings mean? |
| Reports evidence | Interprets evidence |
| Presents statistical findings | Connects findings with previous research |
| Uses tables and figures | Explains implications |
| Remains objective | Considers meaning and limitations |
Understanding results and discussion in research paper structure can make the manuscript much clearer.
9. Build the Manuscript Around One Research Story
Once the analysis and interpretation are ready, writing becomes much easier.
A typical empirical paper may contain:
| Section | Purpose |
|---|---|
| Title | Clearly identifies the study |
| Abstract | Summarizes the research |
| Introduction | Explains the problem, gap, and objectives |
| Methods | Describes how the research was conducted |
| Results | Presents the findings |
| Discussion | Interprets the findings |
| Conclusion | States the main message and implications |
| References | Documents cited sources |
This generally aligns with the IMRaD format, which stands for Introduction, Method, Results, and Discussion.
However, always check the target journal because section requirements can vary.
Your manuscript should tell one connected story:
Question → Method → Analysis → Findings → Interpretation → Conclusion
10. Check the Manuscript Before Publication
Good research data analysis can still result in a weak paper if the manuscript is unclear.
Before moving toward research paper publication, ask:
- Is the research objective clearly stated?
- Does the analysis match the research design?
- Are statistical findings reported accurately?
- Are tables and figures understandable?
- Does the Discussion interpret rather than repeat the Results?
- Are citations and references consistent?
- Are ethical statements included where required?
- Has the manuscript been checked for originality?
- Does it follow the target journal's instructions?
A publication-ready paper needs both sound research and clear communication.
11. Choose the Right Journal
Now the research reaches another important decision:
Where should this paper be submitted?
A technically strong manuscript can still receive a desk rejection if the journal is outside its scope or does not accept the article type.
Check:
- Journal aims and scope
- Subject area
- Article type
- Target readership
- Author guidelines
- Editorial policies
- Relevant indexing requirements
- Similar articles recently published by the journal
Do not choose a journal only because it promises rapid publication or advertises a particular metric.
The objective is not simply to publish quickly. It is to submit the right research to an appropriate scholarly journal.
Common Problems Researchers Face After Data Collection
| Researcher's problem | What may be needed |
|---|---|
| "I have data but don't know which test to use." | Review the research question, variables, study design, and assumptions. |
| "I have SPSS output but cannot explain it." | Identify relevant findings and interpret them in research context. |
| "My Results and Discussion are repetitive." | Separate reporting of findings from interpretation. |
| "My analysis is complete but my paper is weak." | Improve structure, interpretation, language, tables, and references. |
| "I don't know where to submit." | Match the manuscript with verified journal scope and requirements. |
From Data Analysis to Research Paper Submission
The journey is not over even after the analysis has been completed.
The process comes to an end once the data is analysed into a paper that clearly communicates:
What was studied → How it was studied → What was found → What it means → Why it matters
That is the actual meaning behind research data analysis.
If you have already finished collecting your research data but are having trouble with statistical analysis, interpreting the results, preparing and editing your manuscript, formatting, journal selection, or submitting your research paper, professional assistance in research and publication, such as Mikky Publication, can help fill the gap between your dataset and manuscript.
Your data contains the evidence. Your research paper gives that evidence a voice.
Frequently Asked Questions
1. What should researchers do before analyzing collected data?
The researchers should clean the data, check for missing values, correct errors, verify coding, retain original copies, and ensure that the variables are appropriate for the intended analysis.
2. How can researchers choose an appropriate statistical method?
Select methods based on the research questions, objectives, study design, type of variables, measurement scales, underlying assumptions, and particular evidence required to answer them.
3. Should every statistical result appear in the research paper?
No. Researchers need to present data that is relevant to their aims and questions by means of adequate tables, graphs, statistics, and explanations.
4. How are Results and Discussion sections different?
The results section provides the findings of the study. The discussion section interprets the findings and makes comparisons with the literature also acknowledges limitations.
5. When should researchers start preparing for journal submission?
Journal requirements should be considered early. Before submission, verify scope, article type, formatting, ethics statements, references, files, and all submission requirements.
Mikky Publication Experts
Mikky Publication Editorial
Published September 1, 2026